


Internet Advertising - An Essential Component for Marketing in the Treatment Industry?
Cursory Evaluation of Internet Advertising Data and Market Penetration in the Addiction Treatment Industry
By: Chooper's Guide
Management at Chooper's Guide elected to include recent statistics on Internet Advertising provided by PricewaterhouseCoopers (PWC) to emphasize the necessity of incorporating Search and Display AD formats to your Marketing Strategy. We have included several graphs that illustrate the trend growth, Internet Advertising Format Type, Advertising Revenues by Media Type and Advertising Revenues by Industry.
INTERNET MARKET OVERVIEW – THE BIG PICTURE
The internet has become the leading global information resource since 2000 with a 566% increase in usage statistics. Estimated number of users worldwide has increased from 360m in 2000 to 2.45b in 2012. In North America, 78.6% (274m) of the population (348m) now uses the internet. This surge in popularity has caused a significant paradigm shift impacting every sector of the economy. The book has been rewritten on marketing and communications for major corporations, private industry, healthcare and the general population. Internet advertising revenues have steadily increased from 7b in 2000 to 36.6b in 2012. Today’s business world demands a strategically well designed internet presence.
SUBSTANCE ABUSE INDUSTRY OVERVIEW
The Substance Abuse Industry in the United States has approximately 15,000 licensed and non-licensed treatment facilities and over 97,000 addiction specialists (counselors, social workers, interventionists, physicians) who annually provide treatment to over 1.9 million persons with substance abuse disorders. Annual treatment facility revenues exceed 20b. Unlike other areas in the Healthcare industry, the Substance Abuse Treatment sector has yet to establish uniform standards for treatment and business practices. The industry as a whole is highly fragmented with the top 50 treatment organizations accounting for only 20% of gross industry revenues.
ADVERTISING AND MARKET PRESENCE
The marketplace for internet advertising in the Substance Abuse industry is still in its infancy. Although 72.8% (9,935) of Treatment Facilities report a website presence, few, if any, have harnessed the internet as the primary marketing platform for treatment referrals. There are approximately one dozen treatment directories that sell advertising services in this space however the overall subscription rate is minimal and the technology and functionality of most of these sites is outdated.
SUMMARY
The high level of fragmentation, lack of standardization and minimal use of technology as a business solution make this sector extremely attractive. A cursory overview suggests that market penetration is below 10% and an opportunity exists for providers that offer a value added, comprehensive solution
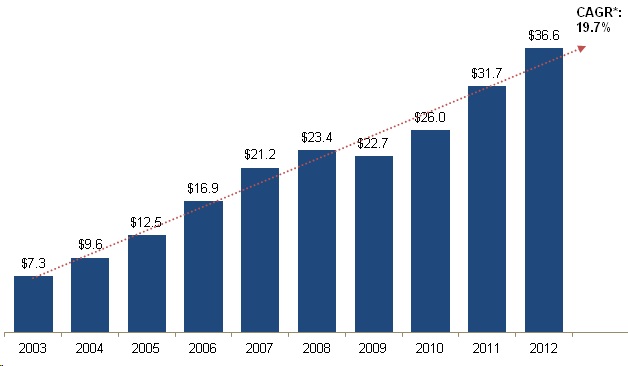
Revenue continues strong growth in 20122012 annual revenues increased on a year-over-year percentage and dollar basis. The 19.7% CAGR* has far outpaced U.S. real GDP growth of 1.5%** over the same 10-year period. |
 |
|
Search and Display continue to lead ad formats, while Mobile growth remains strong
|
 |
|
Internet advertising inches closer to Broadcast Television* advertising revenueInternet has continued to grow in significance when compared to other U.S. ad- supported media†. In 2011, Internet advertising revenues surpassed those of Cable Television**; and in 2012, the gap between Internet and Broadcast Television* narrowed. † The total U.S. advertising market includes other segments not charted here. * Broadcast Television includes Network, Syndicated and Spot television advertising revenue. ** Cable Television includes National Cable Networks and Local Cable television advertising revenue. *** Magazine includes Consumer and Trade magazines.
|
 |
|
Internet ad revenues by major industry category*2011 vs. 2012* Industry definitions may have changed over the time period depicted, both within the survey process and as interpreted by survey respondents. Amounts do not total to 100% as minor categories are not displayed. |
 |
|
| Sources: IAB Internet Advertising Revenue Report; PwC |


